Published on
Fact sheet
Comparing the impacts of two vehicles
Methodology details
Context
This document details the sources and methodology for comparing vehicles based on size. The comparator tool was developed by the mobility team at Équiterre as part of the Human-Scale Transportation awareness campaign.
The calculation models for the various calculator indexes were developed in conjunction with Dunsky, a consulting firm specializing in energy transition and sustainable development.
The methods used in Équiterre’s Running Electric campaign are also used to establish the numeric values for each model’ costs and fuel consumption.
This tool grew out of the observations from the Équiterre study Understanding the rise of light-duty trucks in Canada: Reversing the trend.
Choice of vehicles featured
The comparator uses a sample of vehicles for sale to the Quebec public, broken down by major categories. The objective is to be able to compare the impacts of vehicle size, based on consumer needs. The following vehicle categories are used:
Subcompact cars
Crossovers (also called subcompact SUVs)
Compact cars
Compact SUVs (sometimes called small SUVs)
Midsize cars
Midsize SUVs
Vans
Full-size SUVs
Compact pickup trucks
Full-size pickup trucks
The comparator isn’t overly concerned with vehicle categories, since these are fluid in the minds of consumers, just as they are asymmetrical depending on the automotive manufacturer or analyst.
1 The confusion surrounding vehicle categories (and the reasons for this confusion) are explored in the report Light-Duty Trucks: Definitions and how the Supply has Evolved, one of a series of reports prepared by the Chaire Mobilité de Polytechnique Montréal in connection with the Équiterre study Understanding the rise of light-duty trucks in Canada: Reversing the trend.
The 6 to 8 top-selling models in each category are represented, as determined by the annual statistics published by Automédia.ca (2021). Also represented are the top-selling electric models from each category, as well as plug-in hybrids, in order to illustrate the impacts of electrification in choosing a vehicle.
For trucks and SUVs, the base all-wheel drive variant was chosen (when available) as it is a distinctive feature that is often identified in surveys on the buying motivations of this type of vehicle.
To ensure that the comparator properly reflects Quebecers’ choices, the vehicle pool represents nearly 70% of new cars sold in Quebec in 2021.
Overall score
The overall score is the average of the three indexes (Environment, Danger and Finance). It is presented for information purposes only, and to make it easier to compare the various vehicles. In fact, the various indexes reflect trade-offs among very different risks that cannot reasonably be added up or divided among themselves.
It is up to each person to judge the importance attached to each issue relating to the size of the vehicle chosen, based on their needs and values.
Classification methodology
For each of the indexes we used a percentile statistical approach to divide the data set into intervals. For a given index, we defined the categories as follows:
Classification 1: models with a value above the 90th percentile
Classification 2: models with a value equal to or above the 80th percentile, and below the 90th percentile (10% of the data between the 80th percentile (80%) and the 90th percentile (90%))
Classification 3: models with a value above the 70th percentile and equal to or below the 80th percentile
Classification 4: models with a value above the 60th percentile and equal to or below the 70th percentile
Classification 5: models with a value above the 50th percentile and equal to or below the 60th percentile
Classification 6: models with a value above the 40th percentile and equal to or below the 50th percentile
Classification 7: models with a value above the 30th percentile and equal to or below the 40th percentile
Classification 8: models with a value above the 20th percentile and equal to or below the 30th percentile
Classification 9: models with a value above the 10th percentile and equal to or below the 20th percentile
Classification 10: models with an index value below or equal to the 10th percentile.
This classification awards a grade out of 10 to each vehicle. The lowest is 1/10 and the highest is 10/10.
Environment index
The Environment index compares CO2 emissions attributable to the vehicle model over its entire life cycle (manufacture and use). This is an important index of a vehicle’s environmental impact.
The index grades the vehicles on a scale of 1 to 10, 1 being the worst choice and 10 the best in terms of CO2 emissions.
The GHG emissions data are drawn from the CarbonCounter.com tool developed by MIT. The tool’s parameters are adapted to simulate the Quebec context.
Emissions from EV recharging: 30 gCO2eq/kWh
Emissions from electricity production: 450 gCO2eq/kWh (average mix in United States)
Emissions from battery production: 100 gCO2eq/kWh (default value)
Distance travelled annually: 13,000 miles
Plug-in hybrid utility factor: Lower (lower than EPA estimates).
Units: SI / International
The percentile values are based on the sample of the 302 vehicle models stored in the CarbonCounter.com tool.
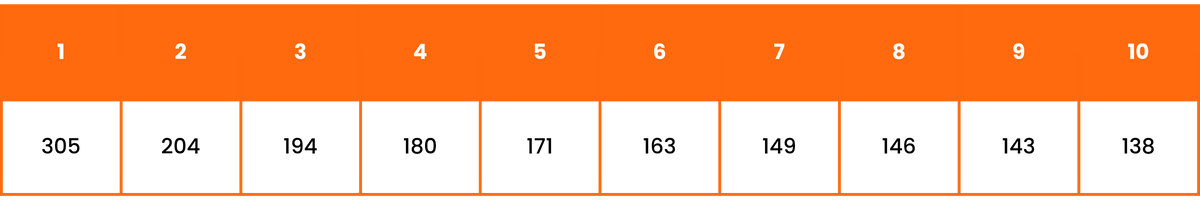
Table 1: Maximum CO2 emissions value (g CO2 eq / km (lifecycle)) per Environment index unit.

Median value: 271 g CO2 eq / km
2 Closest value to rate of 34.5 g eq. CO2/kWh. This emission rate reflects the emissions from the electricity produced, transported and distributed by Hydro-Québec, which also includes “imported” electricity. See the page GHG emissions and Hydro‑Québec electricity.
3 This parameter quantifies the electricity emissions consumption to manufacture vehicles and produce the fuel (gasoline). Since most of the EVs bought in Quebec, as well as half of the gasoline burned in that province, come from the United States, it makes sense to choose the average American intensity as a parameter.
4 This parameter varies greatly according to battery origin, but the default value of 100 gCO2eq/kWh is representative of the average estimates used in most EV lifecycle analyses (Carbon Counter methodological notes).
5 Closest value to 20,000 km, as used for the comparator’s other indexes.
6 It has been shown that in real-world usage, plug-in hybrids run on electric far less than what is announced in the official figures. See the ICCT (2020) white paper. The Running Electric calculator data have also been corrected for this.
GHG emissions graphic
For each model, the comparator details the emissions attributable to the manufacture and use (energy) of the vehicle over its lifecycle, according to the same parameters used for the other indexes (20,000 km per year for 15 years of useful life). These data are drawn from the CarbonCounter.com tool mentioned above.
The data on manufacture include the manufacture of the vehicle itself along with its batteries, in the case of an electric, hybrid or plug-in hybrid vehicle.
The data on energy (vehicle use) include the production of the gasoline fuel (from oil well to pump) as well as combustion in the vehicle. For rechargeable vehicles, the data also include emissions relating to the production and distribution of the electricity used.
Danger index (overall index)
The Danger index compares the risk level posed by each vehicle model to other road users. The overall index is whichever value is lowest (worst) between vehicle size (height) and vehicle mass (weight).
The data used to build the indexes are drawn from the Canadian Vehicle Specifications (CVS) database. The percentile values are based on two critical user safety characteristics: Curb Weight (CW) and Overall Height (OH).
The Canadian Vehicle Specifications database does not provide information on the height of the vehicle’s nose, per se. That is why overall height is used, under the assumption that a taller vehicle will also have a higher nose, in all likelihood.
NB: This index can only compare the risk of serious injuries or fatalities from collisions with pedestrians, cyclists or occupants of other vehicles. It is not a quantitative representation of the severity of injuries, nor is it a representation of the likelihood of collision or an assessment of vehicle occupant safety (driver or passengers).
Height-related danger index
The research shows a correlation between vehicle height (more specifically the vehicle nose height) and the severity of child, pedestrian and cyclist injuries arising from a collision.
7 See the Équiterre study Understanding the rise of light-duty trucks in Canada: Reversing the trend.
8 Also see the study published in the Journal of Safety Research in September 2022, which details the causal links between vehicle size (height and mass) and injury severity.
In general, the taller the vehicle, the graver the injuries among children, pedestrians and other vulnerable users. This impact is confirmed by the rise in the rate of serious and fatal injuries observed in the (Quebec) SAAQ data based on the category of vehicle involved in the accident (without another automobile being involved).
The index ranks vehicles on a scale of 1 to 10, 1 being the worst choice and 10 the best in terms of vehicle height.
The data used to build the indexes are drawn from the Canadian Vehicle Specifications (CVS) database. The percentile values are based on Overall Height values for all models catalogued in Canada for the 2011-2022 model years.
Table 2: Maximum vehicle height values (cm) per unit of Danger index (height)
Median value: 163 cm
Mass-related danger index
The research shows a correlation between vehicle mass (commonly referred to as weight) and the severity of collision injuries.
In general, the greater the vehicle mass (the heavier the vehicle), the greater the kinetic energy triggered during a collision. This impact is confirmed by the rise in the rate of serious and fatal injuries observed in the (Quebec) SAAQ data based on the category of vehicle involved in the accident.
The index ranks vehicles on a scale of 1 to 10, 1 being the worst choice and 10 the best in terms of vehicle mass.
The data used to build the indexes are drawn from the Canadian Vehicle Specifications (CVS) database. The percentile values are based on Curb Weight (CW) values for all models catalogued in Canada for the 2011-2022 model years.
Table 3: Maximum vehicle mass values (kg) per unit of Dangerous Index (height).
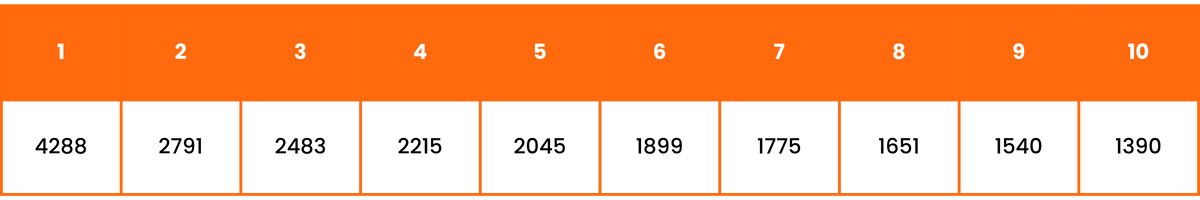
Median value: 1899 kg
9 See the report entitled Light-duty trucks: impacts of the transformation of the light-duty vehicle fleet, part of a series of reports prepared by the Chaire Mobilité de Polytechnique Montréal in connection with the Équiterre study.
10 See the Équiterre study Understanding the rise of light-duty trucks in Canada: Reversing the trend.
11 Also see the study published in the Journal of Safety Research in September 2022, which details the causal links between vehicle size (height and mass) and injury severity.
12 See the report Light-Duty Trucks: Definitions and how the Supply has Evolved, one of a series of reports prepared by the Chaire Mobilité de Polytechnique Montréal in connection with the Équiterre study.
Finance index
The Finance index compares the estimated ownership costs for each vehicle model. These include monthly payments, fuel costs (electricity, if applicable), maintenance and upkeep, insurance and licensing.
The index ranks vehicles on a scale of 1 to 10, 1 being the worst choice and 10 the best in terms of financial load relating to vehicle ownership and use.
The GHG emissions data come from CAA's Driving Costs Calculator. The tool’s parameters are adapted to mesh with the calculation methods used in the other indexes.
Province: Quebec
Vehicle condition: New
Annual mileage: 20,000 km
Year: 2022 (to remain close to the percentile values used)
Make: Automatic model (excluding options). For light-duty trucks, SUVs and cross-overs, all-wheel drive as a standard feature is chosen to reflect the enthusiasm for this type of vehicle (whether useful or not). This feature is a big selling point for these types of vehicles.
The depreciation value has been excluded from the ownership costs index to make it easier to understand the recurrent costs (depreciation affects ownership costs only upon vehicle resale, after a certain point (this period was arbitrarily set at 5 years in the CAA tool). The fluctuating nature of depreciation also factored into its exclusion from this tool.
The percentile values are based on microdata from the 2021 model year drawn from the CAA calculator. The statistical properties of this information appear in the report entitled Light-duty trucks: impacts of the transformation of the light-duty vehicle fleet, part of a series of reports prepared by the Chaire Mobilité de Polytechnique Montréal in connection with the Équiterre study.
The data on this platform are the property of Vincentric, which authorized their use for academic research. To consult the specific data for a particular model, visit CAA's Driving Costs Calculator website.
13 Temporal variations in the depreciation data were observed during data collection. These are explained by the definition and method of calculating the depreciation value by CAA. Depreciation is calculated on the basis of vehicle supply and demand on the market, which can rapidly fluctuate over time.
Table 4: Maximum ownership costs value ($/yr) without depreciation per unit of Finance Index.
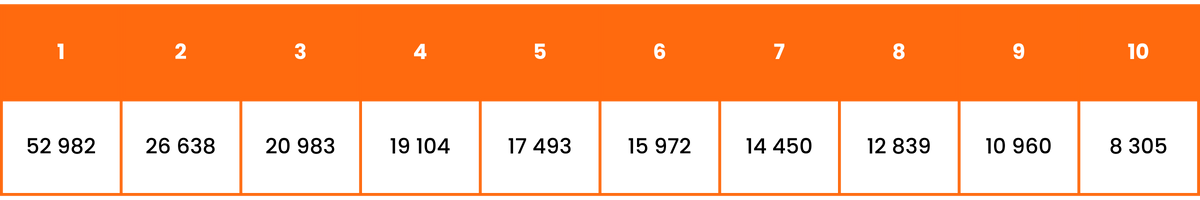
Median value: $15,148/year
To establish the percentiles and thus obtain 10 categories to rank the vehicles (10th percentile, 20th percentile, …, 90th percentile) to ensure a classification methodology in line with the other indexes, we operated on the assumption that the MSRP and the ownership cost follow a normal distribution. While imperfect, this assumption can be justified by the central limit theorem, which posits that the more vehicle cost data we add to the database, the more the distribution of these data will trend toward a random Gaussian (normal) distribution.
Important note on the limitations of this index: The values used to define the Finance Index ranges express an order of magnitude. There should not be any precise and discrete values specific to any models in particular. Rather, these values express the range of possibilities when it comes to ownership costs.
We are adding the value ranges for various ownership cost items, irrespective of the models these costs are attributed to. For example, the outlier values correspond to theoretical vehicles with the highest or lowest costs, both in terms of energy, maintenance, insurance and licensing. In reality, though, these vehicles likely don’t exist.
Also, the value ranges making up this index transpose statistical properties expressed in quartiles in the report Light-duty trucks: Factors contributing to the transformation of the light-duty vehicle fleet prepared by the Chaire Mobilité de Polytechnique Montréal. To create the percentiles, the data on the median, the standard deviation and the standard normal distribution z-scores at various percentiles are used.
Use of this distribution remains valid for comparing vehicles among themselves, but not for inferring precise values in terms of ownership cost differences.
Information on sale prices (MSRP)
For each model, the comparator presents the manufacturer’s suggested retail price (MSRP) for Quebec, taken from the Car Guide site. The MSRP excludes dealer prep and delivery charges, as well as the various applicable taxes and any financing charges.
When the vehicle is eligible for provincial and/or federal rebate programs for plug-in cars, the MSRP is presented as is (without deducting the subsidy), for an “apples-to-apples” comparison with non-subsidized models.
The taxes are deducted from the subsidy amount because they apply on an AFTER-tax basis in the real world. The following formula is applied: Amount with taxes / GST and QST amount combined (1.14975) = Amount without taxes
Information on fuel consumption
For each model, the comparator indicates the fuel consumption and/or electricity consumption per 100 km. This information comes from the latest Fuel Consumption Guide produced by Natural Resources Canada.
This information is used to calculate the energy costs (next section).
Energy costs table
For each model, the comparator details the energy costs based on the price of gasoline. The baseline annual mileage is the same as for the other indexes in the interests of consistency (20,000 km per year).
The energy cost per 100 km is also illustrated, in reference to the information on fuel consumption (usually quantified per 100 km).
The price of gasoline is adjustable to account for the volatility of market prices.
The hydro rate used in the calculations is standardized at $0.11209/kWh, which is the rate cited by Hydro-Québec in its own savings calculator.
For plug-in hybrid vehicles, the energy costs are weighted to better reflect reality. Recent studies by the International Council on Clean Transportation (ICCT) have shown than in real-world use, plug-in hybrids run on electric far less than what is announced in the official figures.
The ICCT (2020) white paper analyzed usage among a sample of over 100,000 vehicles, including 84,000 in North America. For the North American sample, the relationship between a vehicle’s electric range and the utility factor (UF) seems consistent and solid enough for us to use it as the basis for the various plug-in hybrid model calculations.
The following linear regression was inferred from the results of ICCT’s 2020 white paper. It is used to determine the UF for each plug-in hybrid model (it is the same formula used in the Running Electric calculator).
UF = 0.698 x EPA electric range + 11.9
Important note on energy cost estimates: The values indicated are for information purposes. Fuel consumption (and thus energy costs) vary a great deal according to each person’s driving and charging habits, as well as road conditions.